Indicator Dashboards
Roles Required: Admin, Power, Splunk_System_Role, User, can_delete, ess_user, ess_analyst, ess_admin.
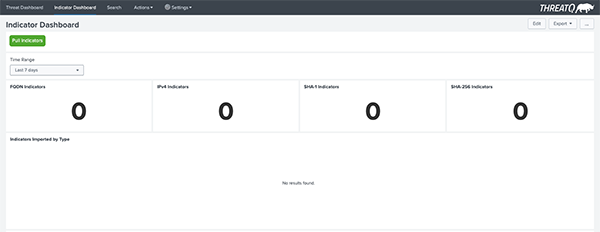
The Indicator Dashboard displays indicator-related widgets, such as type counts and bar charts, for a user-specified time frame.

Info Tab
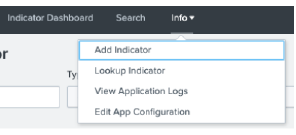
The Dashboard Info tab, located next to the Search Option, provides you with the ability to perform indicator and application log searches along with shortcuts to the Add Indicator and Edit App Configuration functions.

Add Indicator
The Add Indicator option will open the Add Indicator input from within the dashboard. You can use this form to manually add indicators to ThreatQ.

Indicator Lookup
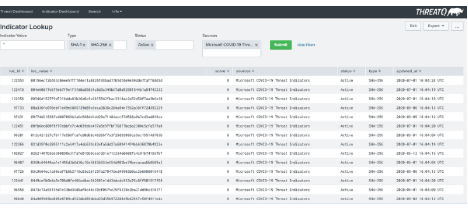
The Indicator Lookup option allows you to perform a search based on:
- IndicatorValue
- IndicatorType
- Status
- Source(s)

Application Log Search
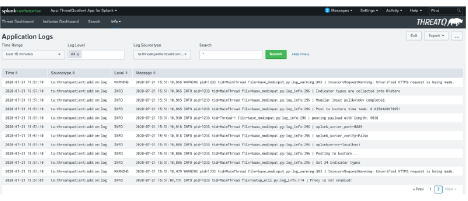
The Application Log Search allows you to perform a search of logs based on:
- Time Range
- Log Level
- Log Source Type
- Search

Edit App Configuration
The Edit App Configuration open will open the app's Setup page. See the configuration section of the Installing the App Component topic for more details.