Current ThreatQ Version Filter
Monitoring Feed Activity
Use the integration’s Activity Log to investigate one feed. Use Feed Run Activity to review runs across feeds. The platform retains feed run activity for the previous 90 days.
Review From Integration Details Page
- Open the feed from My Integrations to view its details page.
- Select the Activity Log tab.
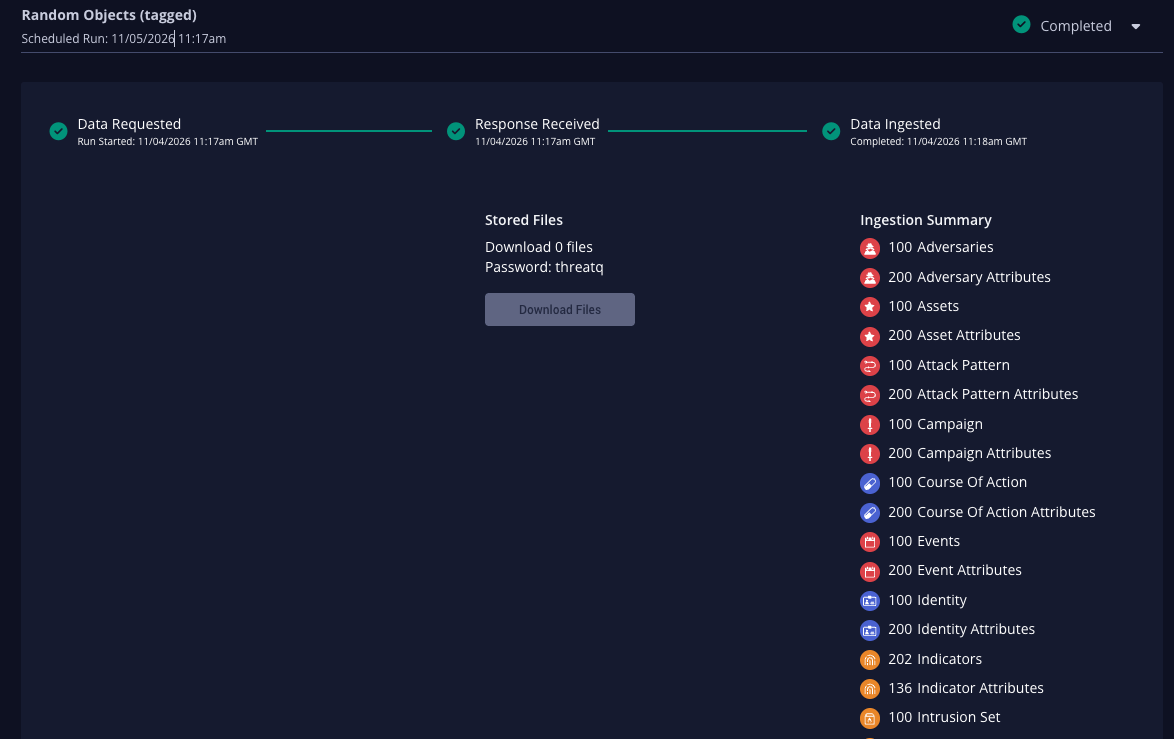
- Expand a run using the arrow beside its outcome to view timestamps, ingestion details, and any available stored files.

Review Runs Across Feeds
- Open My Integrations and select the Feed Run Activity tab.
The default view shows the last seven days.
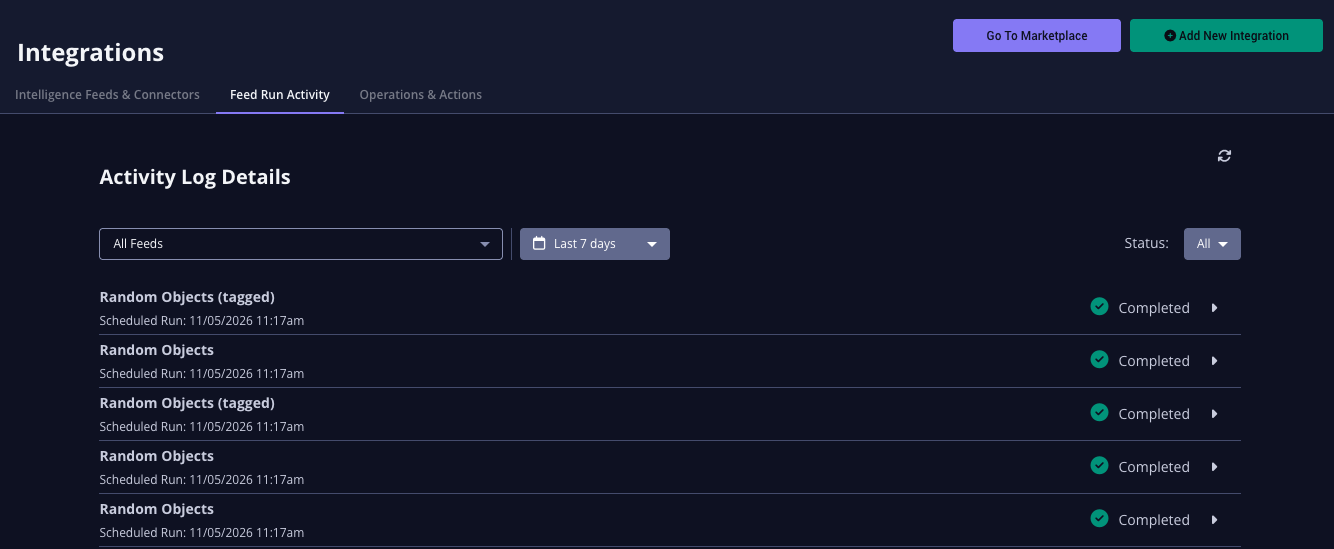
- Choose a time range:
- last 24 hours
- last 7 days
- last 30 days
- last 90 days.
- You can filter the list by feed name and status.
- Expand a run to review its details. Refresh the list to retrieve current activity.
Run detail Meaning Type of Run Whether ThreatQ scheduled the run or a user triggered it manually. Date and Time When the run was initiated. Outcome / Feed Run Status Whether the run completed, completed with errors, or failed. Run Started Timestamp when the run began. Response Received Timestamp when the feed endpoint responded. Data Ingested Timestamp when processing and ingestion completed. Query Range Time window requested from the provider. Ingested Summary Summary of the object types ingested. Store Files Password-protected ZIP files containing ingested data, when available.
Review from My Integrations List
The Intelligence Feeds & Connectors tab shows each integration’s category, version, last and next run, schedule, recent run indicators, and average ingest. You can use Off Schedule and Run Errors filter options to narrow the list down to a specific feed behavior.
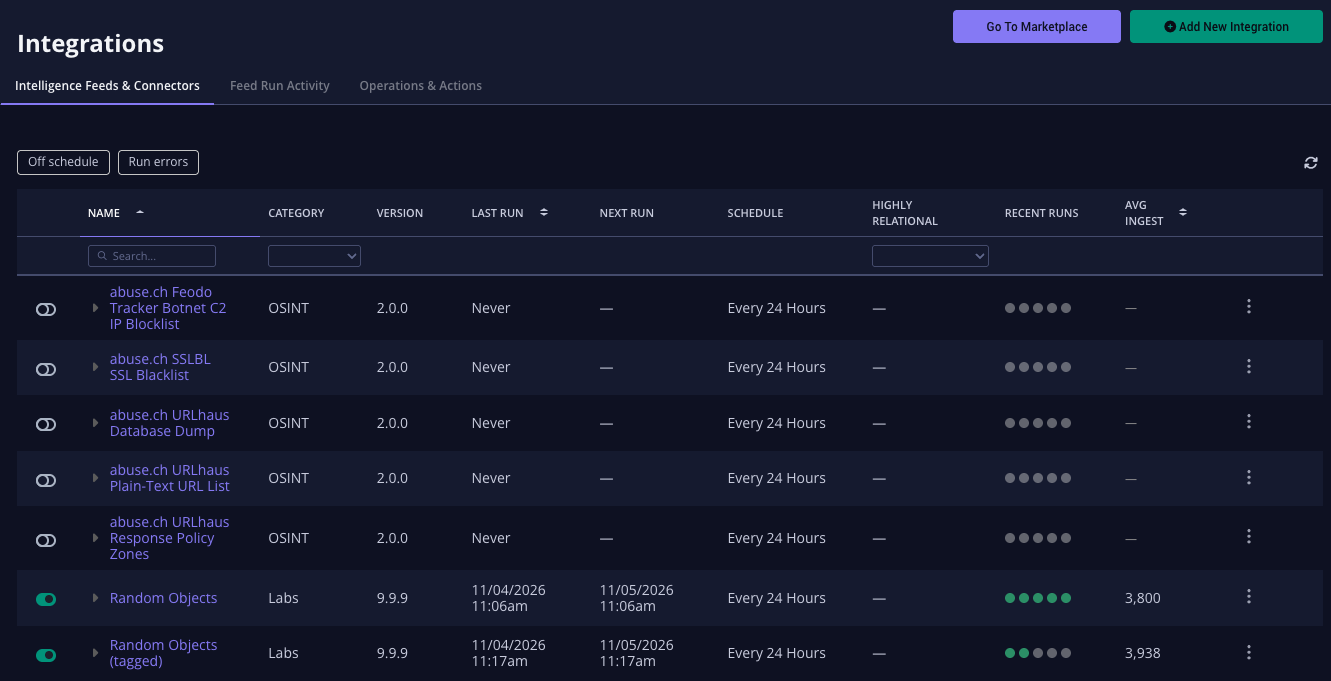
Expand a row to see its five most recent runs. Green indicates success, yellow/orange indicates completion with errors, and red indicates failure.
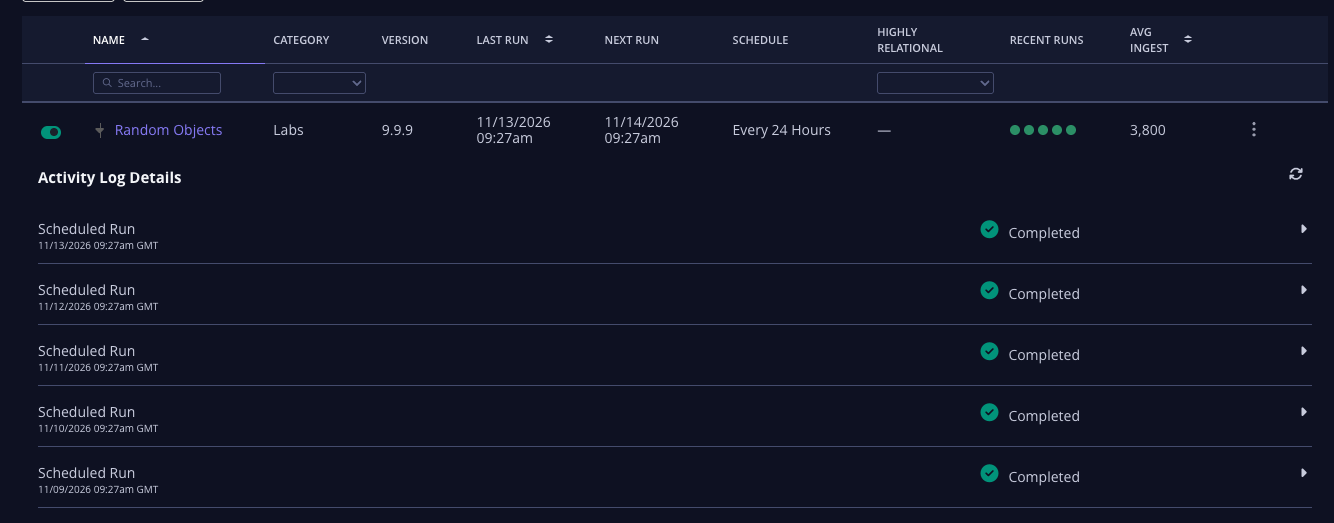
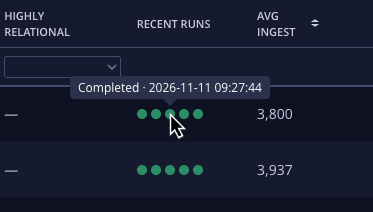
Hover over a run icon for a status summary.