Dashboard Widgets
Default ThreatQ Role: Administrative, Maintenance, or Primary Contributor
Custom Role - Action Permissions: Artifact Management - Dashboards
You can use the following Dashboard Widgets to build your custom dashboards: Bar Chart, Description, Line Chart, Pie Chart, Count, and Table.
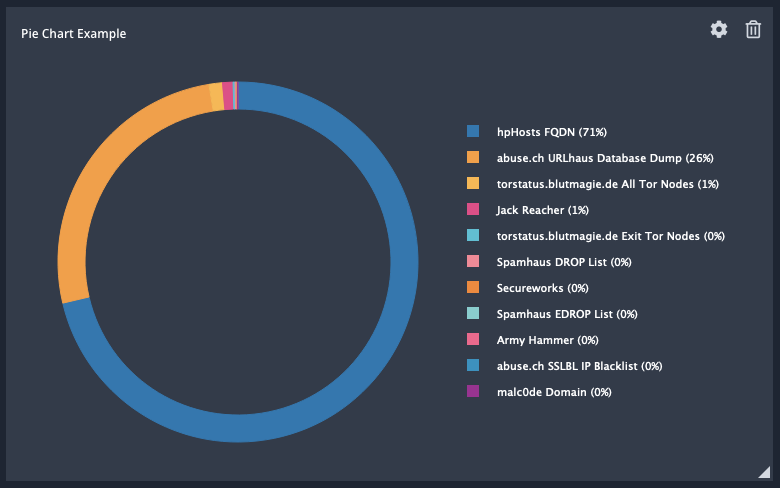
Why do my chart segments add up to over 100%? In the case that an object matches more than one segment in the chart, it is counted individually for each segment. For example, when using a pie chart to represent the sources in your Threat Library, objects that have multiple sources will appear in multiple segments.
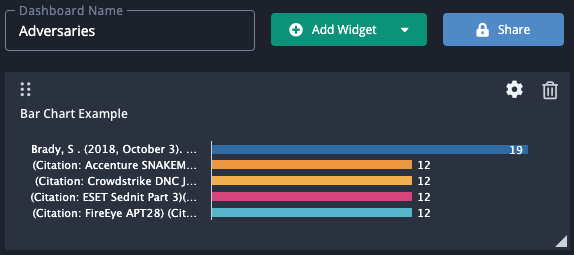
Bar Chart
You can click on individual bars within the chart to view those results in the Threat Library.
Bar charts that include score data include scores greater than ten as a part of the bar representing objects with a score of ten.
Complete the following fields to add a Bar Chart widget to your custom dashboard.
| Field | Description |
|---|---|
| Title | The title that will appear above the widget. |
| Automatically Update | The refresh time for the data. Options include:
|
| Data Collection | Select the data collection to populate the data. |
| Object | Select a specific object type to display. |
| Group By | Select a data column to sort the information such as source, tags, etc. You have the option to group event and custom objects by status and/or point of contact in bar chart widgets. The group by status option is displayed only if an Admin or Maintenance user has configured Event Statuses in the Object Management page.
If you group your bar chart by a date/time, such as grouping by Modified At, the bar chart displays the time in UTC regardless of currently configured system or user timezone display. |
| Visual Display | Select whether to show the bar chart horizontally or vertically. |
| Show Top Options | Select the number of results to display. Options include:
|
Description
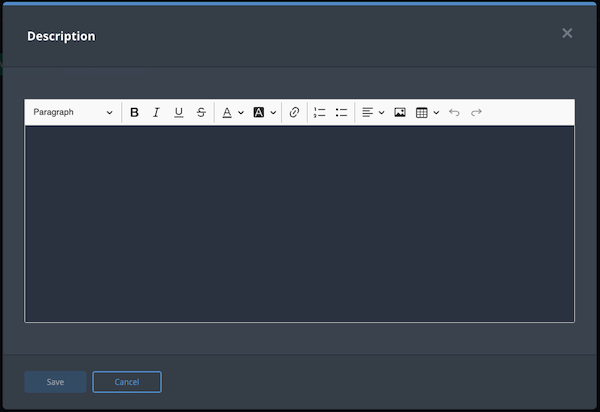
The Description widget allows you to provide further context and additional instructions for your custom dashboard. You can use the supplied editor to format your content.
Tips and Tricks for Adding Images to Description Widgets
- Image captions - Add your image captions after you select your image alignment. If you change alignment after adding a caption, the caption is removed and must be added again.
- Image text alternatives - If you add an image text alternative to an image, it is available for use by screen reading tools but is only displayed on screen if the image fails to load. It is not displayed when you hover on the image.
- Add a line above or below - When you click an image, the arrow icons located on the bottom left and top right corners allow you to insert a line above (top right arrow) or below (bottom left arrow) the image.
- Resize an image - The resize image option allows you to adjust your image to 25%, 50%, or 75% of the size of the Description field. Or, you can return your image to its original size.
Line Chart
The Line Chart widget displays object information in a linear graph using the following date stamps:
- Date Created (all object types)
- Last Modified (all object types)
- Expiration Date (indicators only)

Complete the following fields to add a line chart widget to your custom dashboard.
| Field | Description |
|---|---|
| Title | The title that will appear above the widget. |
| Automatically Update | The refresh time for the data. Options include:
|
| Data to Show in Widget | Select the data collection to populate the data. |
| Object | Select a specific object type to display. |
| Date Metric | The date stamp to use with the line chart. Options include:
|
| Time Range | The time range from today to be displayed. Options include:
|
| Time Segments | Select how the dates will be displayed on the line chart. Options include:
|
Count
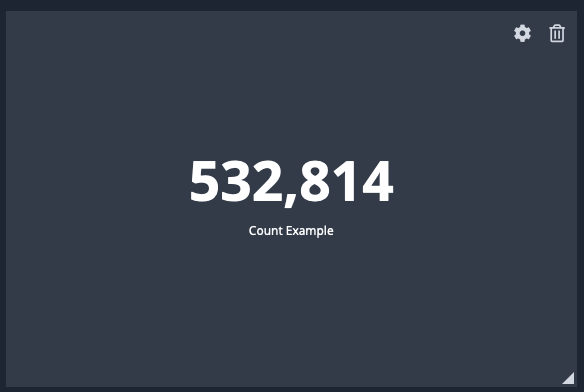
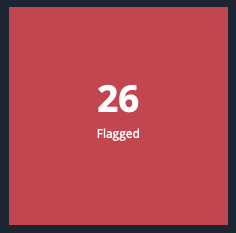
The Count widget displays the total number a specific object type. You can configure the widget to display a different background color if the total number of objects associated with the widget is above or below a specific value.
Complete the following fields to add a Count widget to your custom dashboard.
| Field | Description |
|---|---|
| Title | The title that will appear above the widget. |
| Automatically Update | The refresh time for the data. Options include:
|
| Data to Show in Widget | Select the data collection to populate the data. |
| Object | Select a specific object type to display. |
| Emphasize Data Using Color | Check this box to use different colors to highlight the widget if the count is less than or greater than a specific value. If checked, you will be prompted to select a count value and background color. |
Pie Chart
You can click on individual segments within the chart to view those results in the Threat Library.
Complete the following fields to add a Pie Chart widget to your custom dashboard.
| Field | Description |
|---|---|
| Title | The title that will appear above the widget. |
| Automatically Update | The refresh time for the data. Options include:
|
| Data Collection | Select the data collection to populate the data. |
| Object | Select a specific object type to display. |
| Group By | Select a data column to sort the information such as source, tags, etc.
You have the option to group event and custom objects by status and/or point of contact in pie chart widgets. The group by status option is displayed only if an Admin or Maintenance user has configured Event Statuses in the Object Management page. |
Table
Table widgets allow you to add as many column fields as needed. You can click on a row's value entry to view it in the ThreatQ Threat Library. You can also click on the eye ![]() icon for a row to view a preview of the system object details.
icon for a row to view a preview of the system object details.
If your table lists files, you also have the option to preview or download each file as long as the file is not malware locked.
You cannot preview a malware locked file.
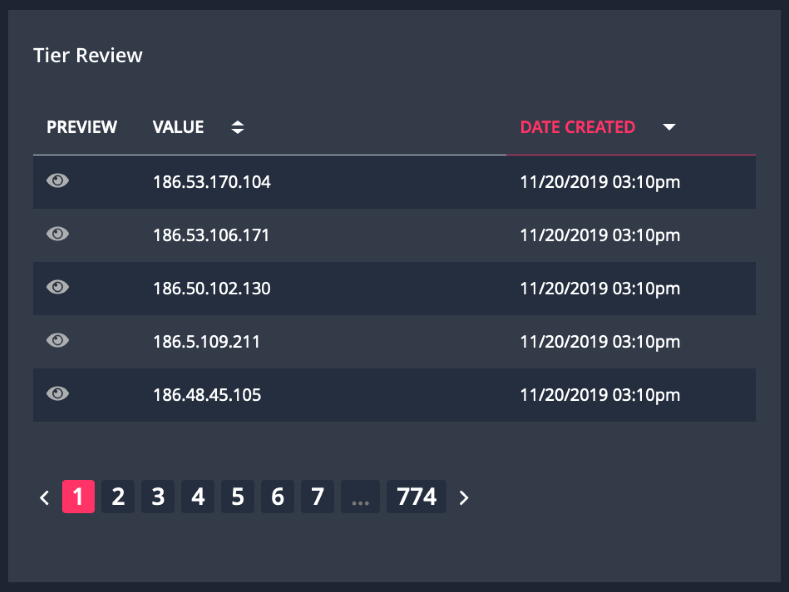
Complete the following fields to add a Table widget to your custom dashboard.
| Field | Description |
|---|---|
| Title | The title that will appear above the widget. |
| Automatically Update | The refresh time for the data. Options include:
|
| Data Collection | Select the data collection to populate the data. |
| Object | Select a specific object type to display. |
| Group By | Select a data column to sort the information such as source, tags, etc. |
| Manage Columns | Select the data columns to display in the table. Click the Add Columns option to add more columns to your table. |
| Sorting | Select the column to sort the table and the order (ascending/descending). |