Indicator Analytics Dashboard
Default ThreatQ Role: Administrative, Maintenance, or Primary Contributor
Custom Role:
- Action Permissions: Objects & Context - Objects (all object types) OR Data Access Permissions: Indicator
- Action Permissions: Artifact Management - Dashboards
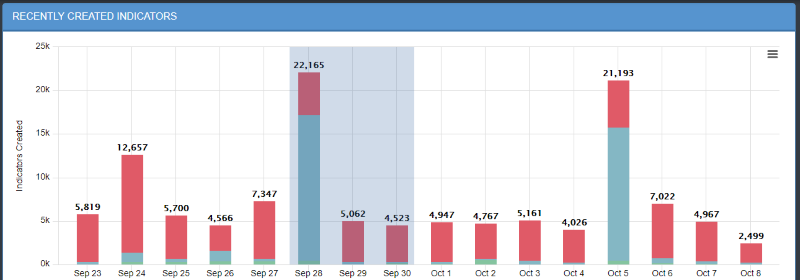
The Indicator Analytics dashboard provides an insight into what Indicators have been added to the system within the last 15 days, as well as an overview of how many indicators fall under each indicator type.
Recently Created Indicators Histogram
The histogram is organized by date. Daily indicator totals are at the top of each column. Each bar is broken down into colors, one for each indicator type.

The following functions are available:
| Function | Details |
|---|---|
|
Viewing the number of indicators created each day by type |
Hover over a colored section to view a popup showing how many attempts of a particular type (for example, MD5, SHA-1, SHA-256) were made on that date.
|
|
Zooming in for a closer view |
|
|
Printing the histogram or downloading it as a PNG, JPEG, PDF, or SVG file |
Click the hamburger menu |

Most Recent 100 Indicators
The Most Recent 100 Indicators list displays the 100 most recently reported Indicators.

The following functions are available:
| Function | Details |
|---|---|
| Sort the Table | Click on the different table headings to sort that table by that column. |
| Search and Filter Table Results | Click on one of the search boxes at the top of the columns and enter a keyword to filter the results.
You can use the supplied dropdown selections for the Status and Type columns to filter by system-available values. |
| Modify the Number of Rows Displayed | Click on the Row Count icon located to the top-right of the chart and select a new display count from the dropdown. |
| Access the Indicator Details Page for a Specific Indicator | Click on the specific Indicator to review to open the Indicator's Details page. |
Attributes Table
The attributes list on the left side displays attributes related to Indicators in your system.

The following functions are available:
| Function | Details |
|---|---|
| Change the Number of Entries Displayed in the Table | Click the Row Count icon located to the top-right of the chart and select a new display count from the dropdown. |
| Search/Filter Attributes and Values | Click within the search box at the top of the column, and enter your search criteria. |
| View More Information About a Selected Attribute |
|

Recent Sources
The Recent Sources Scatter plot displays how many indicators were provided by a given source each day within a specified time frame.

The following functions are available:
| Function | Details |
|---|---|
| View the Date and Number of Indicators from a Given Source |
|
| Adjust the Date Range of the Information Displayed |
The default date range is 30 days.
|
| Hide Values from the Scatterplot |
|

Attack Phases
Attack Phases are the ways an indicator might be used and are listed as indicator attributes. The Attack Phases pie chart displays the number of indicators that fall under each attack phase.

The following functions are available:
| Function | Details |
|---|---|
| View the Number of Indicators for an Attack Phase |
|
| Adjust the Date Range for the Information Displayed |
The default Date Range is 30 days.
|
| Hide a Values from the Pie Chart |
|