Current ThreatQ Version Filter
Adversary Analytics Dashboard
The Adversary Analytics dashboard provides an overview of all the Adversaries within ThreatQ as well as overlapping use of specific indicators.
Adversaries Summary Table
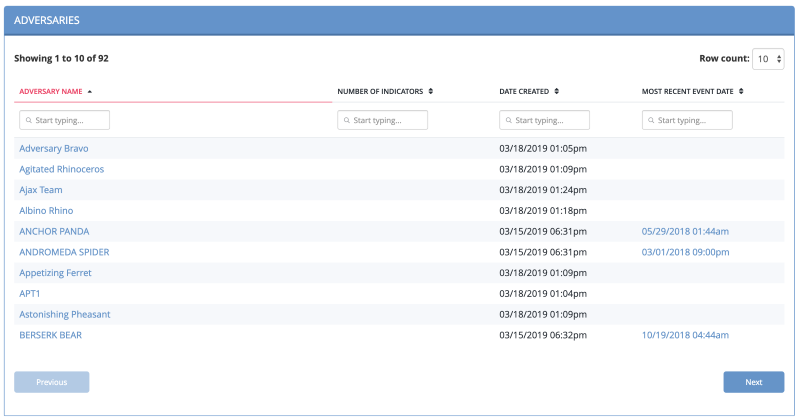
The Adversaries Summary table lists Adversaries by name, number of Indicators, date created, and the most recent event date associated with the adversary.

The following functions are available:
| Function | Details |
|---|---|
| Opening the Adversary Details page for an adversary | Click the name in the Adversary Name column. |
| Performing a search for related indicators | Click the number in the Number of Indicators column to set the adversary name as a search criterion and open the Advanced Search page. |
| Opening the Event Details page for an adversary event | Click the date in the Most Recent Event Date to open the Event Details page. |
| Changing the number of entries displayed in the table | Click the paging batch option located to the bottom-right of the table. |
| Sorting the table by a column | Click the column header. To reverse the column sorting order, click the header a second time. |
| Searching within the Adversary Name column | Click within the search box at the top of the column, and enter your search criteria. |
Adversaries Overlap Table
The Adversary Overlap table lists Adversaries, the date and time they were created, their type, and any overlapping indicators.

The following functions are available:
| Function | Details |
|---|---|
| Opening the Adversary Details page for an adversary | Click the name in the Adversary Name column. |
| Opening the Indicator Details page for an overlapping indicator | Click the identity in the Overlapping Indicator column. |
| Changing the number of entries displayed in the table | Click the paging batch option located to the bottom-right of the table. |
| Sorting the table by a column | Click the column header. To reverse the column sorting order, click the header a second time. |
| Searching within a column | Click within the search box at the top of the column, and enter your search criteria. |
Indicator Distribution Pie Chart
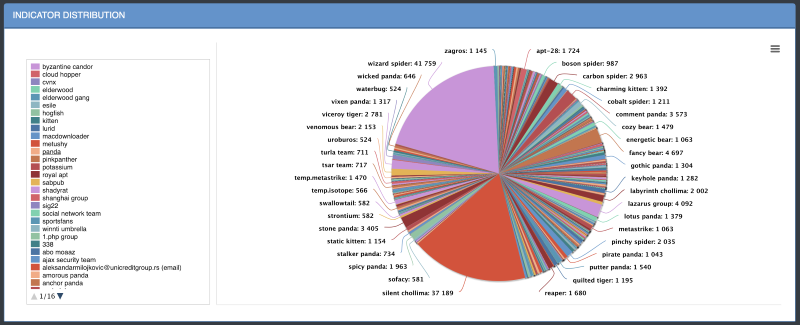
The Indicator Distribution pie chart shows you how many indicators are associated with all adversaries.

The following functions are available:
| Function | Details |
|---|---|
| Viewing more information about a selected value | Hover over a colored section of the pie chart to open a popup identifying the indicator, the number of times the indicator was found and what percentage of the total number of indicators it represents. |
| Hiding or unhiding one of the values from the pie chart | Click the indicator on the left of the pie chart to remove it; click a second time to reinstate it. |
| Printing the graph or saving it as a PNG, JPEG, PDF, or SVG | Click the hamburger menu |