Threat Dashboards
Roles Required: Admin, Power, Splunk_System_Role, User, can_delete, ess_user, ess_analyst, ess_admin.
The Threat Dashboard displays indicator sighting-related information such as:
- Cumulative Counts
- Score Breakdown
- Type Breakdown
- Source Breakdown
- Adversaries Breakdown
- Static Table View
- Top 10 By Sightings
- Indicators Malware Family Distribution
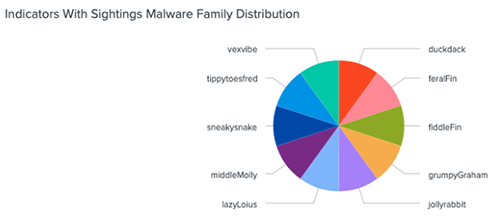
- Indicators with Sightings Malware Family Distribution
Cumulative Counts
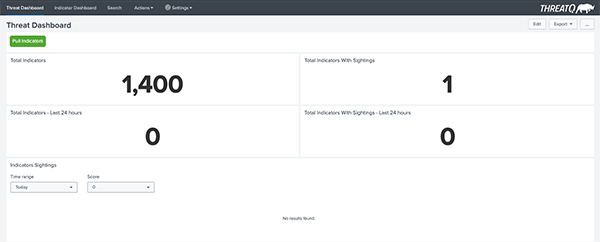
The top section of the dashboard shows total count for all ThreatQ indicators in the master lookup table (on the left) and the match lookup table (in the right) (all time and the last 24 hours). It is important to note that the data displayed as Sightings are not the total sightings; rather it is the total number of indicators for which evidence of sightings has been found. Example screen capture below.
Score Breakdown
The next section shows the distribution of indicator scores for indicators in master and match lookup tables as bar charts. Example screenshot below. These charts do not have a time filter. The counts for individual score breakdown represent the cumulative indicator count. As an example, notice that there are two indicators with sightings each with score 9 (which matches up with the cumulative sightings count of 2 in the chart above).

Type Breakdown
This section shows the distribution of indicator types for indicators in master and match lookup tables as pie charts. As the score distributions above, these are cumulative distributions. Example screenshot below. Hovering over each portion of the pie chart will display the indicator count for that specific portion.

Source Breakdown
This section shows the breakdown of indicators and sighted indicators by sources. Example screenshot below. One thing to note here is that all indicators must have at least one source, but some indicators may have more than one. For this reason, the cumulative counts in the charts below may exceed the total number of indicators and sighted indicators in the lookup tables.

Adversaries Breakdown
This section shows the breakdown of indicators and sighted indicators by adversaries. Example screenshot below. One thing to note here is that not all indicators have adversaries; although some indicators may have more than one. Depending upon how many indicators have adversaries, the total cumulative counts in the charts below may be less or more than the total indicators and sighted indicators in the lookup tables. For the example dataset below, there is only one adversary assigned to a few indicators, and those same indicators are sighted.

Static View Table
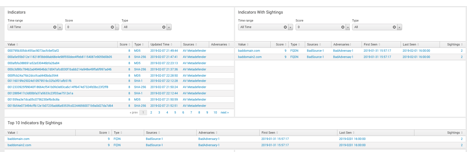
This section shows all indicators and sightings in static tables - time filters are provided and defaulted to the last 24 hours. Score and type filters are also available for both. This information gives a threat analyst a single place to view all sightings in Splunk. In the screenshot below, notice there are two indicators sighted, each with 2 sightings.
Top 10 By Sightings
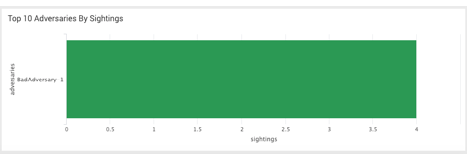
The final section displays top 10 indicators by sightings, top 10 sources by sightings and top 10 adversaries by sightings in the form of a static table, bar chart and bar chart respectively. This information gives an analyst a quick view of the indicator’s sources and adversaries with the most matches within Splunk.

Sources
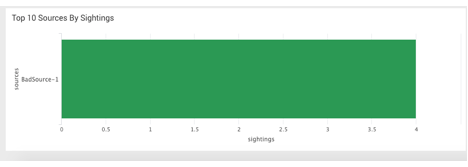
Example screenshot below. Notice the source BadSource-1 appears as the top source with sightings corresponding to the sighted indicators as displayed in the static table above. Also notice that the sightings count is 4, which corresponds to 2 sightings each for the sighted indicators.
Adversaries
Example screenshot below. Notice the source BadAdversary-1 appears as the top adversary with sightings corresponding to the sighted indicators as displayed in the static table above. Also notice that the sightings count is 4, which corresponds to 2 sightings each for the sighted indicators.
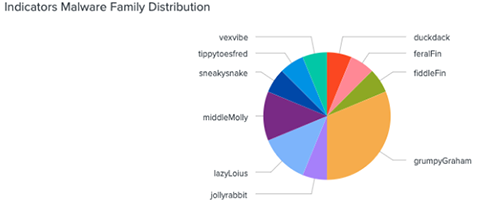
Indicators Malware Family Distribution
The Indicators Malware Family Distribution widget provides a pie with breakdown of indicator malware information.
Indicators with Sightings Malware Family Distribution
The Indicators with Sightings Malware Family Distribution widgets provides a pie chart breakdown of indicators with malware sightings.
